Assets analyzer
The Analyzer is a powerful tool to build your own reports and perform data analysis based on your own personal needs. This feature functions just like a pivot chart in Excel. You have nearly all of the data fields for assets available to build nearly any kind of report. The report can be saved as a setting and placed on your dashboard for easy access. You also have the ability to export this report. *Note: If the Analyzer is not currently active in your account, please contact our Support team to enable this feature for you.
Creating a report using the analyzer
- Click on the Assets menu icon, then select Assets.
- Filter the Asset list to include the records you want to report on.
- Click the Print/Report button and choose Analyzer. *Note: If you have filtered the Asset list before running the analyzer, the same filters will apply to the data that is displayed.
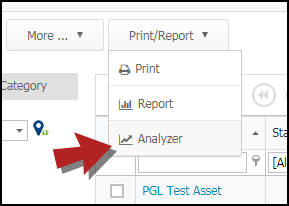
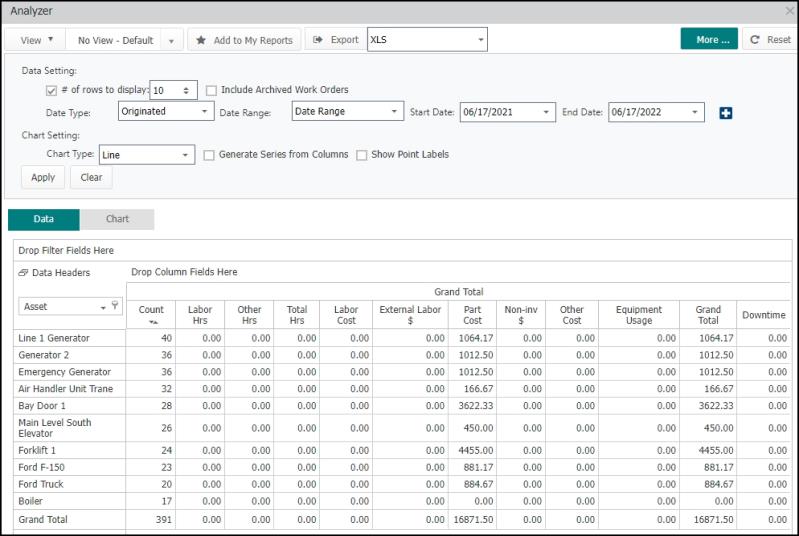
- A data table will be displayed showing basic information on your Assets. To see a visual representation of this data table click on the Chart button.
- You can choose which Assets you want to see by clicking the filter icon in the Asset column.
- By default, the tool will include Asset totals for labor and costs as column headers.
- To remove a column header, hover your mouse over the Data Headers icon. A field list will appear representing the columns in the data chart. Right-click the field you do not want to show and select Hide from the menu that appears.
- To rearrange the column headers, hover your mouse over the Data Headers icon. A field list will appear representing the columns in the data chart. Click and drag the field(s) that you need to rearrange to the appropriate position and the chart will update automatically.
- To add additional fields and reorganize the data table, right-click the top of the table and select Show Field List.
- The PivotGrid Field List window will appear.
- Here you can drag and drop additional fields into the Filter Area, Column Area, Row Area, or Data Area.
- Dragging a field into one of these areas will immediately update the data chart to reflect the change. If you wish to make changes without the chart updating immediately, check the Defer Layout Update box to prevent the chart from updating until the Update button is clicked.
- To see additional options for your report, click the More button.
- Here you can change the Data settings to display more rows, include archived work orders, and select date options.
- You can also change Chart Settings to display a different chart type, generate series from columns, and show point labels.
- Click Apply after making any changes.
Saving the report
The Analyzer tool allows you to save your report in several ways. You can set it as the default view when launching the Analyzer, add the report to the My Reports section of your dashboard, and export the report in several file formats.
Views
When you have finished making your report you can set the report to automatically show as your default view when you launch the Analyzer.
- Click the View button.
- Select New.
- Enter a Name for the View.
- Check the Set as My Default box to set the view as the default view when the Analyzer launches.
- Check the Available to others box to allow other users to access this view.
- Click OK to save your changes.
- You can switch between views in the drop down menu next to the view button.
My Reports
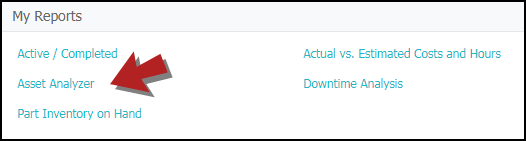
- You also have the ability to save the reports to your My Reports section of the Dashboard by clicking the Add to My Reports button.

- Give the report a Name and click Save. The report will then appear in the My Reports section of your Dashboard.
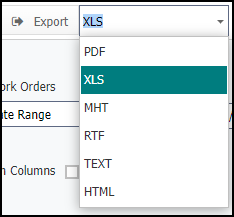
Exporting
- If you need to export the report you can do so by selecting the file format of the export from the drop down then clicking the Export button.